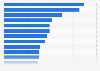
Average number of vloggers U.S. viewers watch each week 2018

Average number of vloggers watched by adult vlog viewers in the United States on a weekly basis as of November 2018

Download
Show detailed source information?
Register for free
Already a member?
Log in
Source

Use Ask Statista Research Service

Release date

December 2018

Region

United States

Survey time period

November 29 to 30, 2018

Number of respondents

371 respondents

Age group

18 years and older

Special properties

adults who watch vlogs at least once a week

Method of interview

Online survey

Supplementary notes

Survey question: "How many different vloggers, on average, do you watch a week? Please select the option that best applies."

Citation formats
Statista Accounts: Access All Statistics. Starting from $2,388 USD / Year
Basic Account
Get to know the platform

You only have access to basic statistics.
This statistic is not included in your account.

Starter Account
The ideal entry-level account for individual users
  • Instant access to 1m statistics
  • Download in XLS, PDF & PNG format
  • Detailed references
$199 USD / Month *
Professional Account
Full access

Business Solutions including all features.

* Prices do not include sales tax.

Statistics on " Social content sharing "

Other statistics that may interest you Social content sharing

User behavior

6

Opinion sharing

8

Photo and video sharing

8

Mobile social

8

Facebook

7

Reddit

8

Further related statistics

19
Statista Accounts: Access All Statistics. Starting from $2,388 USD / Year
Learn more about how Statista can support your business.