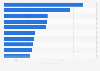
The United States account for the largest share of YouTube's lifetime app revenue - U.S. user spending in the YouTube app amounted to 223.4 million U.S. dollars in 2018, compared to only 53.8 million U.S. dollars from other countries. In 2019 YTD, U.S. YouTube users spent more than 381 million U.S. dollars in the app.
Worldwide user spending in the YouTube mobile app from 2015 to 2019, by region (in million U.S. dollars)
Basic Account
Get to know the platform
You only have access to basic statistics.
This statistic is not included in your account.
Starter Account
The ideal entry-level account for individual users
- Instant access to 1m statistics
- Download in XLS, PDF & PNG format
- Detailed references
$199 USD / Month *
Professional Account
Full access
Business Solutions including all features.
* Prices do not include sales tax.
Other statistics that may interest you Statistics on
About the industry
10
- Premium Statistic Share of Netflix time among total TV content viewing in the U.S. 2021-2023
- Premium Statistic Monthly Twitch revenue in Poland 2022-2023
- Premium Statistic Monthly Twitch downloads in Poland 2022-2023
- Premium Statistic OTT video services revenue in Russia 2014-2023
- Premium Statistic Online video revenue in Russia 2018-2022, by model
- Premium Statistic Leading VOD platforms in Russia 2022, by revenue share
- Premium Statistic Global TikTok downloads 2023, by country
- Premium Statistic TikTok iOS revenue in leading markets Q4 2023
- Premium Statistic TikTok Google Play revenue in leading markets Q4 2023
- Premium Statistic Global TikTok iOS downloads Q4 2023, by country
About the region
10
- Premium Statistic Global TikTok Android DAU 2019-2022
- Premium Statistic Global TikTok Android MAU 2019-2022
- Premium Statistic Global TikTok iOS DAU 2019-2022
- Premium Statistic Global TikTok iOS MAU 2019-2022
- Premium Statistic Number of Netflix viewers who have watched selected shows and movies 2021
- Premium Statistic Global mobile video penetration 2016-2021
- Premium Statistic Global YouTube celebrity or vlogger viewership 2016, by age group
- Premium Statistic YouTube usage reach worldwide 2013-2015
- Premium Statistic Number of users of OTT video worldwide 2020-2029
- Premium Statistic Penetration rate of OTT video worldwide 2019-2029
Other regions
10
- Premium Statistic Over-the-top video services market revenue in Sweden 2021-2029, by segment
- Premium Statistic Romania: online video sources 2015
- Premium Statistic Czech Republic: online video sources 2015
- Premium Statistic Turkey: online video sources 2015
- Premium Statistic New Zealand: online video sources 2015
- Premium Statistic Hong Kong: online video viewing locations 2014
- Premium Statistic Ukraine: online video sources 2015
- Premium Statistic Estonia: online video sources 2015
- Premium Statistic France: online video sources 2015
- Premium Statistic Singapore: online video viewing locations 2014
Related statistics
10
- Basic Statistic U.S. parents of a young child whose child has watched YouTube videos 2020
- Premium Statistic Italy: YouTube videos optimal length 2018
- Basic Statistic U.S. YouTube mobile usage reach 2015, by device
- Basic Statistic Quarterly consumer spend on mobile apps per user 2019-2023
- Basic Statistic Leading mobile Android app audience and data intelligence SDKs 2024
- Basic Statistic Leading mobile Android app backend and cloud SDKs 2024
- Basic Statistic Leading mobile Android app CRM SDKs 2023
- Basic Statistic Leading mobile Android app analytics SDKs 2024
- Basic Statistic Leading mobile Android app ad network SDKs 2024
- Basic Statistic Leading mobile Android app attribution SDKs 2024
Further related statistics
1
Further Content: You might find this interesting as well
Sensor Tower. (December 11, 2019). Worldwide user spending in the YouTube mobile app from 2015 to 2019, by region (in million U.S. dollars) [Graph]. In Statista. Retrieved May 13, 2024, from https://www.statista.com/statistics/1083941/global-mobile-youtube-user-spend-app/
Sensor Tower. "Worldwide user spending in the YouTube mobile app from 2015 to 2019, by region (in million U.S. dollars)." Chart. December 11, 2019. Statista. Accessed May 13, 2024. https://www.statista.com/statistics/1083941/global-mobile-youtube-user-spend-app/
Sensor Tower. (2019). Worldwide user spending in the YouTube mobile app from 2015 to 2019, by region (in million U.S. dollars). Statista. Statista Inc.. Accessed: May 13, 2024. https://www.statista.com/statistics/1083941/global-mobile-youtube-user-spend-app/
Sensor Tower. "Worldwide User Spending in The Youtube Mobile App from 2015 to 2019, by Region (in Million U.S. Dollars)." Statista, Statista Inc., 11 Dec 2019, https://www.statista.com/statistics/1083941/global-mobile-youtube-user-spend-app/
Sensor Tower, Worldwide user spending in the YouTube mobile app from 2015 to 2019, by region (in million U.S. dollars) Statista, https://www.statista.com/statistics/1083941/global-mobile-youtube-user-spend-app/ (last visited May 13, 2024)
Worldwide user spending in the YouTube mobile app from 2015 to 2019, by region (in million U.S. dollars) [Graph], Sensor Tower, December 11, 2019. [Online]. Available: https://www.statista.com/statistics/1083941/global-mobile-youtube-user-spend-app/