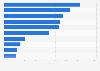
As of 2016, the sales value growth of branded generic drugs in the Philippines was 71.1 percent and increased throughout the years. Notably, sales of unbranded generics have significantly increased, while originator drugs have slipped for the past years.
Yearly growth rate of drug sales in the Philippines from 2007 to 2016, by type of license
Basic Account
Get to know the platform
You only have access to basic statistics.
This statistic is not included in your account.
Starter Account
The ideal entry-level account for individual users
- Instant access to 1m statistics
- Download in XLS, PDF & PNG format
- Detailed references
$199 USD / Month *
Professional Account
Full access
Business Solutions including all features.
* Prices do not include sales tax.
Other statistics that may interest you Statistics on
About the industry
10
- Premium Statistic Pharmaceutical market size in Argentina 2008-2021
- Basic Statistic Gross profit for various pharmaceutical distributors before EBITDA from 2016-2017
- Premium Statistic Mexico: pharmaceutical market size 2015-2017
- Premium Statistic Colombia: pharmaceutical market size 2015-2017
- Premium Statistic Chile: pharmaceutical market size 2015-2017
- Premium Statistic Ecuador: pharmaceutical market size 2015-2017
- Premium Statistic Peru: pharmaceutical market size 2015-2017
- Premium Statistic Latin America: pharmaceutical market size 2017, by country
- Premium Statistic Brazil: pharmaceutical market size 2015-2017
- Basic Statistic Number of applications for drug reimbursement in Denmark 2013-2022
About the region
9
- Premium Statistic Major source of pharmaceutical products Philippines 2022, by import value
- Premium Statistic Import volume of medicaments Philippines 2018-2022
- Premium Statistic Import value of pharmaceutical products Philippines 2011-2022
- Premium Statistic Export value of pharmaceutical products Philippines 2011-2022
- Premium Statistic Market share corporations pharmaceutical sales value Philippines 2007-2016, by type
- Premium Statistic Number of employees pharmaceutical manufacturing Philippines 2006 & 2012, by region
- Premium Statistic Production workers pharmaceutical manufacturing Philippines 2006 & 2012, by region
- Premium Statistic Number of retail traders in the pharmaceutical industry Philippines 2012, by region
- Premium Statistic Number of traders in the pharmaceutical industry Philippines 2012, by type
Selected statistics
6
- Premium Statistic Annual revenue of Sinopharm 2010-2022
- Premium Statistic Number of employees at Sinopharm 2011-2022
- Premium Statistic Pfizer's ad spending 2006-2023
- Premium Statistic Revenue of Sinopharm 2011-2022, by category
- Premium Statistic Annual revenue of Shanghai Pharmaceuticals 2011-2022
- Basic Statistic M&A capacities - changes for the global pharma industry 2008-2015
Other regions
10
- Basic Statistic Rate of return on biopharma R&D late stage pipeline 2013-2022
- Premium Statistic Saving of U.S. costs through generic pharmaceuticals by condition 2022
- Premium Statistic Massachusetts' medical cannabis spending 2018-2024
- Premium Statistic Leading orphan designations in the EU by indication 2015
- Premium Statistic Biopharmaceutical market size forecast Japan 2011-2020
- Premium Statistic Number of injection drug shortages in Canada 2013-2016, by company
- Premium Statistic Mexico: pharmaceutical expenditure 2012-2018
- Basic Statistic Maine's medical cannabis spending 2018-2024
- Basic Statistic Illinois' medical cannabis sales value U.S. 2018-2024
- Basic Statistic Vermont's medical cannabis sales value U.S. 2018-2024
Related statistics
10
- Premium Statistic Market share of leading domestic pharmaceutical companies Philippines 2016
- Premium Statistic Market share of leading multinational pharmaceutical companies Philippines 2016
- Premium Statistic Market share of licensed drugs pharmaceutical sales Philippines 2007-2016, by type
- Premium Statistic Number of pharmaceutical manufacturing companies Philippines 2006 & 2012, by region
- Premium Statistic Market share of leading pharmaceutical companies Philippines 2016
- Premium Statistic Sales value of pharmaceuticals Philippines 2018-2024
- Premium Statistic Major source countries of pharmaceutical products imports Philippines 2022
- Premium Statistic Average per capita household medical care expenditure Philippines 2012-2015, by type
- Premium Statistic GDP share of pharmaceutical sales Philippines 2018-2024
- Premium Statistic Community based drug rehabilitation participants Philippines 2018
Further related statistics
9
- Global pharmaceutical pipeline by therapy area 2013-2017
- Sanofi's total assets 2007-2023
- Merck & Co total assets 2009-2023
- Pfizer's revenues in the U.S. and abroad 2009-2023
- AstraZeneca's revenue from top product Pulmicort 2006-2023
- Chinese insulin market distribution: leading companies 2011
- U.S. insulin market distribution: leading companies 2011
- Merck & Co - expenditure on research and development 2006-2023
- Merck & Co cash dividends declared 2006-2023
Further Content: You might find this interesting as well
Statistics
- Global pharmaceutical pipeline by therapy area 2013-2017
- Sanofi's total assets 2007-2023
- Merck & Co total assets 2009-2023
- Pfizer's revenues in the U.S. and abroad 2009-2023
- AstraZeneca's revenue from top product Pulmicort 2006-2023
- Chinese insulin market distribution: leading companies 2011
- U.S. insulin market distribution: leading companies 2011
- Merck & Co - expenditure on research and development 2006-2023
- Merck & Co cash dividends declared 2006-2023
PCC. (June 8, 2020). Yearly growth rate of drug sales in the Philippines from 2007 to 2016, by type of license [Graph]. In Statista. Retrieved May 19, 2024, from https://www.statista.com/statistics/1173514/philippines-yearly-growth-of-drug-sales/
PCC. "Yearly growth rate of drug sales in the Philippines from 2007 to 2016, by type of license." Chart. June 8, 2020. Statista. Accessed May 19, 2024. https://www.statista.com/statistics/1173514/philippines-yearly-growth-of-drug-sales/
PCC. (2020). Yearly growth rate of drug sales in the Philippines from 2007 to 2016, by type of license. Statista. Statista Inc.. Accessed: May 19, 2024. https://www.statista.com/statistics/1173514/philippines-yearly-growth-of-drug-sales/
PCC. "Yearly Growth Rate of Drug Sales in The Philippines from 2007 to 2016, by Type of License." Statista, Statista Inc., 8 Jun 2020, https://www.statista.com/statistics/1173514/philippines-yearly-growth-of-drug-sales/
PCC, Yearly growth rate of drug sales in the Philippines from 2007 to 2016, by type of license Statista, https://www.statista.com/statistics/1173514/philippines-yearly-growth-of-drug-sales/ (last visited May 19, 2024)
Yearly growth rate of drug sales in the Philippines from 2007 to 2016, by type of license [Graph], PCC, June 8, 2020. [Online]. Available: https://www.statista.com/statistics/1173514/philippines-yearly-growth-of-drug-sales/