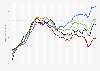
Capacity utilization of the durable consumer goods industry in the Netherlands 2022
This statistic displays the capacity utilization of the durable consumer goods industry in the Netherlands from January 2010 to October 2022. It shows that in October 2022, the Dutch durable consumer goods industry used approximately 86.1 percent of its capacity.