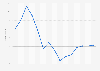
In 2020, the net capital account in Afghanistan amounted to approximately 752.35 million U.S. dollars. Contrastingly, the net capital account in Japan amounted to a deficit of over 1.72 billion U.S. dollars in 2020.
Net capital account in the Asia-Pacific region in 2020, by country (in million U.S. dollars)
Basic Account
Get to know the platform
You only have access to basic statistics.
This statistic is not included in your account.
Starter Account
The ideal entry-level account for individual users
- Instant access to 1m statistics
- Download in XLS, PDF & PNG format
- Detailed references
$199 USD / Month *
Professional Account
Full access
Business Solutions including all features.
* Prices do not include sales tax.
Other statistics that may interest you Statistics on
About the industry
10
- Premium Statistic Net current transfers from abroad APAC 2020, by country
- Premium Statistic Inflation rate APAC 2021-2022, by country
- Premium Statistic Labor productivity APAC 2017, by country or region
- Basic Statistic Gross domestic product (GDP) growth rate in Vanuatu 2029
- Basic Statistic Gross domestic product (GDP) growth rate in Bhutan 2029
- Basic Statistic Gross domestic product (GDP) per capita in Djibouti 2029
- Basic Statistic Gross domestic product (GDP) per capita in Vanuatu 2029
- Basic Statistic Gross domestic product (GDP) per capita in Bhutan 2029
- Basic Statistic Gross domestic product (GDP) growth rate in New Zealand 2029
- Basic Statistic Gross domestic product (GDP) growth rate in Barbados 2029
About the region
10
- Premium Statistic Net secondary income APAC 2022, by country
- Premium Statistic Net primary income APAC 2022, by country
- Premium Statistic Net national income growth APAC 2020, by country
- Premium Statistic Net national income per capita APAC 2019, by country
- Premium Statistic Net national income APAC 2019, by country
- Basic Statistic Most followed Instagram accounts APAC 2023
- Premium Statistic Distribution of GDP across economic sectors in Shenzhen city, China 2012-2022
- Premium Statistic Average spending of residents in Shenzhen 2022, China, by category
- Premium Statistic Value added of essential industries in Shenzhen, China 2020-2022
- Premium Statistic Annual revenue of Shenzhen government 2012-2022
Other regions
10
- Premium Statistic Household expenditure share of domestic tourism spending Philippines 2012-2022
- Premium Statistic Canada Post - total assets 2012-2022
- Premium Statistic Monthly Consumer Confidence Index (CCI) in Slovakia 2010-2023
- Premium Statistic Monthly Consumer Confidence Index (CCI) in Czechia 2018-2023
- Premium Statistic Return on total assets of industrial enterprises in Guangdong, China 2012-2022
- Basic Statistic Latin America & Caribbean: gross domestic product 2022, by country
- Premium Statistic Total segment assets of Kathmandu Holdings Limited FY 2017-2023
- Premium Statistic Taiwan's gross financial assets per capita 2014-2021
- Premium Statistic Corporate sales of the food industry in Japan FY 2013-2022
- Premium Statistic Mexico: expected GDP growth 2023-2024
Related statistics
10
- Premium Statistic Net income from abroad APAC 2022 by country
- Premium Statistic GDP growth APAC 2019-2023, by country
- Premium Statistic Household wealth APAC 2018-2023
- Premium Statistic Gross capital formation Laos 2007-2016
- Premium Statistic Gross savings as a share of GDP in Laos 2004-2016
- Premium Statistic Gross capital formation Mongolia 2013-2022
- Premium Statistic Gross savings as a share of GDP Mongolia 2013-2022
- Premium Statistic Gross capital formation Nepal 2013-2022
- Premium Statistic Gross savings Brunei 2013-2022
- Premium Statistic Gross capital formation Sri Lanka 2008-2022
Further related statistics
10
- Total assets of the China Construction Bank 2013-2023
- Total assets of China Vanke 2022
- Total assets of China Pacific Insurance 2012-2022
- Assets under management of Allianz Group 2005-2023
- Total assets of Wendy's 2009-2023
- Total assets of the InterContinental Hotels Group 2007-2023
- Total assets of Choice Hotels International worldwide 2008-2023
- Total assets of Banco Santander 2001-2023
- Total assets of MGM Resorts International worldwide 2008-2022
- Total assets of Booking Holdings worldwide 2007-2023
Further Content: You might find this interesting as well
Statistics
- Total assets of the China Construction Bank 2013-2023
- Total assets of China Vanke 2022
- Total assets of China Pacific Insurance 2012-2022
- Assets under management of Allianz Group 2005-2023
- Total assets of Wendy's 2009-2023
- Total assets of the InterContinental Hotels Group 2007-2023
- Total assets of Choice Hotels International worldwide 2008-2023
- Total assets of Banco Santander 2001-2023
- Total assets of MGM Resorts International worldwide 2008-2022
- Total assets of Booking Holdings worldwide 2007-2023
World Bank. (September 15, 2021). Net capital account in the Asia-Pacific region in 2020, by country (in million U.S. dollars) [Graph]. In Statista. Retrieved May 23, 2024, from https://www.statista.com/statistics/639908/asia-pacific-net-capital-account-by-country/
World Bank. "Net capital account in the Asia-Pacific region in 2020, by country (in million U.S. dollars)." Chart. September 15, 2021. Statista. Accessed May 23, 2024. https://www.statista.com/statistics/639908/asia-pacific-net-capital-account-by-country/
World Bank. (2021). Net capital account in the Asia-Pacific region in 2020, by country (in million U.S. dollars). Statista. Statista Inc.. Accessed: May 23, 2024. https://www.statista.com/statistics/639908/asia-pacific-net-capital-account-by-country/
World Bank. "Net Capital Account in The Asia-pacific Region in 2020, by Country (in Million U.S. Dollars)." Statista, Statista Inc., 15 Sep 2021, https://www.statista.com/statistics/639908/asia-pacific-net-capital-account-by-country/
World Bank, Net capital account in the Asia-Pacific region in 2020, by country (in million U.S. dollars) Statista, https://www.statista.com/statistics/639908/asia-pacific-net-capital-account-by-country/ (last visited May 23, 2024)
Net capital account in the Asia-Pacific region in 2020, by country (in million U.S. dollars) [Graph], World Bank, September 15, 2021. [Online]. Available: https://www.statista.com/statistics/639908/asia-pacific-net-capital-account-by-country/