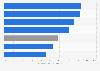
This statistic shows the percentage of people in employment in France between 2014 and 2021, by geographical area. During the period studied, the employment rate grew by more than four points in rural areas, whereas it remained pretty stable in urban areas. The share of employed people was higher in rural areas (69.8 percent in 2020) than in urban areas (64 percent the same year).
Percentage of people in employment in France between 2014 and 2021, by geographical area
Basic Account
Get to know the platform
You only have access to basic statistics.
This statistic is not included in your account.
Starter Account
The ideal entry-level account for individual users
- Instant access to 1m statistics
- Download in XLS, PDF & PNG format
- Detailed references
$199 USD / Month *
Professional Account
Full access
Business Solutions including all features.
* Prices do not include sales tax.
Other statistics that may interest you Statistics on
About the industry
10
- Premium Statistic Share of jobless people in France 2014-2020, by geographical area
- Premium Statistic Labor force and employment in Shanghai 2019, by employment status
- Premium Statistic Labor force and employment in Chongqing, China 2019, by employment status
- Premium Statistic Labor force and employment in Nanjing 2019, by employment status
- Premium Statistic Labor force and employment in Chengdu, China 2019, by employment status
- Premium Statistic Labor force and employment in Hangzhou 2019, by employment status
- Premium Statistic Labor force and employment in Guiyang, China 2019, by employment status
- Premium Statistic Labor force and employment in Beijing 2019, by category
- Premium Statistic Labor force and employment in Hefei 2019, by employment status
- Premium Statistic Labor force and employment in Kunming, China 2019, by employment status
About the region
9
- Premium Statistic French parents reducing their animal product consumption 2019, by type of living area
- Basic Statistic French people willing to leave the city to live closer to nature 2019, by gender
- Basic Statistic Share of French people willing to leave or not the city to live closer to nature 2019
- Basic Statistic Share of urban population in France from 1960-2022
- Basic Statistic Rural population share in France 1960-2022
- Premium Statistic Nights spent by foreign tourists in hotels in France Q4 2019, by area
- Premium Statistic Share of foreign tourists' overnight stays in hotels in France Q4 2019, by area
- Basic Statistic Concerns on ecology and sustainable development in France 2018, by residential area
- Basic Statistic Urbanization in France 2022
Other regions
10
- Basic Statistic Fertility rate in Russia 2000-2022, by type of area
- Basic Statistic Prevalence of U.S. adults meeting exercise standards in 2013, by urban-rural status
- Basic Statistic Degree of urbanization in Saudi Arabia in 2022
- Premium Statistic Share of convenience store types United Kingdom (UK) 2023
- Premium Statistic Infant mortality rate Vietnam 2022, by urbanization level
- Premium Statistic Overnight parking of vehicles in rural and urban areas in England 2016
- Basic Statistic Literacy rate in Andhra Pradesh - by gender 1991-2011
- Premium Statistic Households with farm animals or livestock ownership in Ghana 2018, by area
- Premium Statistic Vacancy rates in rural and urban areas Ontario 2010-2015
- Basic Statistic Italy: unemployment figures by urban-rural typology in 2015
Related statistics
10
- Premium Statistic Female life expectancy at birth in Paris 1991-2022
- Premium Statistic Male life expectancy at birth in Paris 1991-2022
- Basic Statistic Number of people living in Paris, France 2023, by gender
- Basic Statistic Population of Paris 1989-2023
- Premium Statistic Number of people living in Lyon, France 2019, by age
- Premium Statistic Number of people living in Lyon, France 2020, by gender
- Basic Statistic Metropolitan area population in Canada 2022
- Basic Statistic Population in metropolitan areas in Canada 2022, by gender
- Premium Statistic Number of households in Paris 1999-2020
- Premium Statistic Number of people living in Lille in France 2020, by gender
Further Content: You might find this interesting as well
Statistics
Insee. (November 22, 2022). Percentage of people in employment in France between 2014 and 2021, by geographical area [Graph]. In Statista. Retrieved May 06, 2024, from https://www.statista.com/statistics/753625/employment-rate-by-geographical-area-france/
Insee. "Percentage of people in employment in France between 2014 and 2021, by geographical area." Chart. November 22, 2022. Statista. Accessed May 06, 2024. https://www.statista.com/statistics/753625/employment-rate-by-geographical-area-france/
Insee. (2022). Percentage of people in employment in France between 2014 and 2021, by geographical area. Statista. Statista Inc.. Accessed: May 06, 2024. https://www.statista.com/statistics/753625/employment-rate-by-geographical-area-france/
Insee. "Percentage of People in Employment in France between 2014 and 2021, by Geographical Area." Statista, Statista Inc., 22 Nov 2022, https://www.statista.com/statistics/753625/employment-rate-by-geographical-area-france/
Insee, Percentage of people in employment in France between 2014 and 2021, by geographical area Statista, https://www.statista.com/statistics/753625/employment-rate-by-geographical-area-france/ (last visited May 06, 2024)
Percentage of people in employment in France between 2014 and 2021, by geographical area [Graph], Insee, November 22, 2022. [Online]. Available: https://www.statista.com/statistics/753625/employment-rate-by-geographical-area-france/