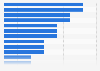
This statistic shows the median home value of owner-occupied homes in the Super Bowl host city of Indianapolis, New England Patriots hometown Boston, and New York City, where the Giants were founded in 1883.
Median home value of owner-occupied homes in Super Bowl host city Indianapolis, Boston, and New York State (in U.S. dollars)
Basic Account
Get to know the platform
You only have access to basic statistics.
This statistic is not included in your account.
Starter Account
The ideal entry-level account for individual users
- Instant access to 1m statistics
- Download in XLS, PDF & PNG format
- Detailed references
$199 USD / Month *
Professional Account
Full access
Business Solutions including all features.
* Prices do not include sales tax.
Other statistics that may interest you Statistics on
About the industry
10
- Premium Statistic U.S. housing: Case Shiller Cleveland Home Price Index 2017-2023
- Premium Statistic U.S. housing: Case Shiller Dallas Home Price Index 2017-2023
- Premium Statistic U.S. housing: Case Shiller Denver Home Price Index 2017-2023
- Premium Statistic U.S. housing: Case Shiller Phoenix Home Price Index 2017-2023
- Premium Statistic U.S. housing: Case Shiller Portland Home Price Index 2017-2023
- Premium Statistic U.S. housing: Case Shiller San Diego Home Price Index 2017-2023
- Basic Statistic U.S. housing: Case Shiller National Home Price Index 2017-2023
- Premium Statistic U.S. housing: Case Shiller Los Angeles Home Price Index 2017-2023
- Premium Statistic U.S. housing: Case Shiller San Francisco Home Price Index 2017-2023
- Premium Statistic U.S. housing: Case Shiller Atlanta Home Price Index 2016-2023
About the region
10
- Premium Statistic U.S. housing: Case Shiller Boston Home Price Index 2016-2023
- Premium Statistic U.S. housing: Case Shiller Chicago Home Price Index 2017-2023
- Premium Statistic U.S. housing: Case Shiller Charlotte Home Price Index 2017-2023
- Premium Statistic U.S. housing: Case Shiller Detroit Home Price Index 2017-2023
- Premium Statistic U.S. housing: Case Shiller Las Vegas Home Price Index 2017-2023
- Premium Statistic U.S. housing: Case Shiller Miami Home Price Index 2017-2023
- Premium Statistic U.S. housing: Case Shiller Minneapolis Home Price Index 2017-2023
- Premium Statistic U.S. housing: Case Shiller New York Home Price Index 2017-2023
- Premium Statistic U.S. housing: Case Shiller Seattle Home Price Index 2017-2023
- Premium Statistic U.S. housing: Case Shiller Tampa Home Price Index 2017-2023
Other regions
10
- Premium Statistic Number of housing starts in Manitoba 1990-2022
- Basic Statistic Czechia: house price index Q1 2016-Q2 2020
- Basic Statistic House-price-to-income ratio in selected countries worldwide 2022
- Premium Statistic Reasons for households in the Netherlands to not invest in sustainable housing 2016
- Basic Statistic Ireland: house price index Q1 2016-Q2 2020
- Premium Statistic Paraguay: number of housing units in AsunciĆ³n 2016, by ownership
- Premium Statistic Breakdown of housings in France 2020, by square meter price
- Premium Statistic Purchasing price of sold vacation homes in Denmark monthly 2016-2021
- Basic Statistic House price index per quarter in Germany 2016-2023
- Premium Statistic Construction cost of buildings per square meter in China 2022, by region
Related statistics
10
- Premium Statistic U.S. housing: Case Shiller Washington DC Home Price Index 2017-2023
- Premium Statistic U.S. housing: Case Shiller 20-City Composite Home Price Index 2000-2022
- Basic Statistic U.S. housing: Case Shiller National Home Price Index 2000-2023
- Premium Statistic U.S. housing: Case Shiller 10-City Composite Home Price Index 2000-2023
- Premium Statistic Purchase-only house price index for the U.S. 1991-2022
- Basic Statistic Purchase-only house price index for Middle Atlantic in the U.S. 1991-2022
- Basic Statistic Purchase-only house price index for South Atlantic in the U.S. 1991-2022
- Basic Statistic Purchase-only house price index for the U.S. Mountain region 1991-2022
- Premium Statistic U.S. housing - national shelter price index 2000-2021
- Premium Statistic U.S. housing: national home price index 1967-2022
Further related statistics
10
- Number of employees at China Vanke 2010-2022
- Total assets of China Vanke 2022
- Number of CBRE Group employees 2009-2023
- Number of employees of Vinci worldwide 1991-2023
- Employee count of Fluor Corporation 2008-2022
- Structure of investment portfolio of Allianz Group 2014-2023
- Crushed stone price in the U.S. 2010-2023
- Leading cement producing countries worldwide 2023
- Global graphite reserves 2023, by country
- Hebei Iron and Steel's (HBIS) gross profit in China 2012-2021
Further Content: You might find this interesting as well
Statistics
- Number of employees at China Vanke 2010-2022
- Total assets of China Vanke 2022
- Number of CBRE Group employees 2009-2023
- Number of employees of Vinci worldwide 1991-2023
- Employee count of Fluor Corporation 2008-2022
- Structure of investment portfolio of Allianz Group 2014-2023
- Crushed stone price in the U.S. 2010-2023
- Leading cement producing countries worldwide 2023
- Global graphite reserves 2023, by country
- Hebei Iron and Steel's (HBIS) gross profit in China 2012-2021
US Census Bureau. (December 15, 2011). Median home value of owner-occupied homes in Super Bowl host city Indianapolis, Boston, and New York State (in U.S. dollars) [Graph]. In Statista. Retrieved May 04, 2024, from https://www.statista.com/statistics/216769/median-home-value-of-owner-occupied-homes-in-super-bowl-host-cities/
US Census Bureau. "Median home value of owner-occupied homes in Super Bowl host city Indianapolis, Boston, and New York State (in U.S. dollars)." Chart. December 15, 2011. Statista. Accessed May 04, 2024. https://www.statista.com/statistics/216769/median-home-value-of-owner-occupied-homes-in-super-bowl-host-cities/
US Census Bureau. (2011). Median home value of owner-occupied homes in Super Bowl host city Indianapolis, Boston, and New York State (in U.S. dollars). Statista. Statista Inc.. Accessed: May 04, 2024. https://www.statista.com/statistics/216769/median-home-value-of-owner-occupied-homes-in-super-bowl-host-cities/
US Census Bureau. "Median Home Value of Owner-occupied Homes in Super Bowl Host City Indianapolis, Boston, and New York State (in U.S. Dollars)." Statista, Statista Inc., 15 Dec 2011, https://www.statista.com/statistics/216769/median-home-value-of-owner-occupied-homes-in-super-bowl-host-cities/
US Census Bureau, Median home value of owner-occupied homes in Super Bowl host city Indianapolis, Boston, and New York State (in U.S. dollars) Statista, https://www.statista.com/statistics/216769/median-home-value-of-owner-occupied-homes-in-super-bowl-host-cities/ (last visited May 04, 2024)
Median home value of owner-occupied homes in Super Bowl host city Indianapolis, Boston, and New York State (in U.S. dollars) [Graph], US Census Bureau, December 15, 2011. [Online]. Available: https://www.statista.com/statistics/216769/median-home-value-of-owner-occupied-homes-in-super-bowl-host-cities/