In 2005, the annual average price for one ounce of the precious metal silver on the Comex exchange was 7.33 U.S. dollars. By 2022, the annual average price of silver grew to 21.82 U.S. dollars per ounce.
Average Comex spot price of silver from 1975 to 2022 (in U.S. dollars per ounce)
Loading statistic...
Basic Account
Get to know the platform
You only have access to basic statistics.
Starter Account
The ideal entry-level account for individual users
- Instant access to 1m statistics
- Download in XLS, PDF & PNG format
- Detailed references
$199 USD / Month *
Professional Account
Full access
Business Solutions including all features.
* Prices do not include sales tax.
Other statistics that may interest you Silver mining industry worldwide
Overview
7
- Basic Statistic Silver reserves worldwide 2010-2023
- Premium Statistic Global reserves of silver 2023, by leading country
- Premium Statistic Global silver mine production 2005-2023
- Basic Statistic Leading global silver producing countries 2022
- Premium Statistic Leading global primary silver mines 2023
- Basic Statistic Distribution of global silver production 2023, by primary source metal
- Premium Statistic Global recycled silver volume 2013-2024
Trade and price
5
- Premium Statistic Silver export value worldwide 2022, by leading country
- Premium Statistic Global distribution of silver imports by country 2021
- Basic Statistic 
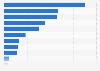
Average Comex spot price of silver 1975-2022
- Premium Statistic Average London fix price of silver 1975-2022
- Premium Statistic Global rate of return on silver investments 2011-2023
Countries
6
- Premium Statistic Global silver mine production 2023, by leading country
- Premium Statistic Share of global silver production 2022, by country
- Premium Statistic Silver mine production in Mexico 2010-2021
- Premium Statistic Silver mine production in China 2010-2021
- Premium Statistic Silver mine production in Peru 2010-2022
- Premium Statistic Production volume of silver globally 2021, by political stability of producers
Companies
5
- Premium Statistic Leading silver producing companies worldwide 2023
- Basic Statistic Annual silver production of Fresnillo 2010-2022
- Premium Statistic Glencore's volumes sold of silver 2015-2023
- Premium Statistic Silver production of Newmont Corporation 2019-2023
- Premium Statistic Polymetal International's silver production 2012-2022
Supply and demand
4
Outlook
3
Further related statistics
13
- U.S. silver imports for consumption 2010-2023
- Distribution of U.S. silver imports by country 2019-2022
- Silver production value in the United States 2010-2021
- Employment in U.S. silver mines and mills 2016-2023
- Global leading silver mining companies based on market cap 2018
- U.S. iron, gold, silver, and other metal ore mining gross output 1998-2016
- Global silver supply distribution by source 2014
- Export value of colloidal precious metals from the United Kingdom (UK) 2016-2022
- Silver demand in China by purpose 2011
- World physical silver demand change percentage by sector 2017
- World silver demand annual change by industrial application 2016
- World physical silver demand change by sector 2017
- Average quarterly gold jewelry demand in Germany Q1 2015 - Q1 2017
Further Content: You might find this interesting as well
Statistics
- U.S. silver imports for consumption 2010-2023
- Distribution of U.S. silver imports by country 2019-2022
- Silver production value in the United States 2010-2021
- Employment in U.S. silver mines and mills 2016-2023
- Global leading silver mining companies based on market cap 2018
- U.S. iron, gold, silver, and other metal ore mining gross output 1998-2016
- Global silver supply distribution by source 2014
- Export value of colloidal precious metals from the United Kingdom (UK) 2016-2022
- Silver demand in China by purpose 2011
- World physical silver demand change percentage by sector 2017
- World silver demand annual change by industrial application 2016
- World physical silver demand change by sector 2017
- Average quarterly gold jewelry demand in Germany Q1 2015 - Q1 2017
The Silver Institute. (April 12, 2023). Average Comex spot price of silver from 1975 to 2022 (in U.S. dollars per ounce) [Graph]. In Statista. Retrieved May 11, 2024, from https://www.statista.com/statistics/253317/comex-spot-price-of-silver-since-1975/
The Silver Institute. "Average Comex spot price of silver from 1975 to 2022 (in U.S. dollars per ounce)." Chart. April 12, 2023. Statista. Accessed May 11, 2024. https://www.statista.com/statistics/253317/comex-spot-price-of-silver-since-1975/
The Silver Institute. (2023). Average Comex spot price of silver from 1975 to 2022 (in U.S. dollars per ounce). Statista. Statista Inc.. Accessed: May 11, 2024. https://www.statista.com/statistics/253317/comex-spot-price-of-silver-since-1975/
The Silver Institute. "Average Comex Spot Price of Silver from 1975 to 2022 (in U.S. Dollars per Ounce)." Statista, Statista Inc., 12 Apr 2023, https://www.statista.com/statistics/253317/comex-spot-price-of-silver-since-1975/
The Silver Institute, Average Comex spot price of silver from 1975 to 2022 (in U.S. dollars per ounce) Statista, https://www.statista.com/statistics/253317/comex-spot-price-of-silver-since-1975/ (last visited May 11, 2024)
Average Comex spot price of silver from 1975 to 2022 (in U.S. dollars per ounce) [Graph], The Silver Institute, April 12, 2023. [Online]. Available: https://www.statista.com/statistics/253317/comex-spot-price-of-silver-since-1975/